
Processing large-scale graph-processing workloads requires similarly large-scale infrastructure, which we know today as data centres: large computing facilities, deploying hundreds or thousands of interconnected computers. Data centres form the basis of today’s digital infrastructure and are necessary for a wide range of societally important tasks, ranging from facilitating government tax administration to sharing social media posts. By combining the capabilities of many machines, the computers in a data centre can complete computationally intensive tasks such as massive graph-processing workloads.
However, powering such large numbers of computers takes a significant and growing amount of energy. The global energy demand of data centres is estimated to reach 8% in 2030 [1]. Unfortunately, burning fossil fuels remains an important and widely used source of energy. This makes data centre construction and operation a significant contributor to greenhouse gas (GHG) emissions.
In this post, we work towards sustainable massive graph-processing workloads by using Graph Greenifier to analyse the effect of temporal shifting (a technique to run workloads with sustainability in mind) on the carbon emission of data centres.
What is Carbon Intensity?
Carbon intensity is a metric that quantifies the (un)sustainability of an energy source by computing the amount of CO2 emitted per unit of energy. The table below presents an overview of the carbon intensity of four highly popular energy sources [1].
| Source | Carbon Intensity (CO2/kWh-eq) |
|---|---|
| Wind | 11 |
| Solar | 41 |
| Oil | 650 |
| Coal | 820 |
Today, in practice, the electricity that is generated from both renewable and non-renewable sources is combined and offered to electricity consumers through an electricity network, also known as the energy grid. This means that electricity consumers on the grid do not use entirely renewable or non-renewable electricity, but rather use whatever combination is put onto the grid by electricity producers.
By knowing how much electricity on an energy grid comes from each source, we can compute the carbon intensity of that grid. To do so, we use the following formula:

Formula for computing grid carbon intensity.
Here, CIg is the carbon intensity of the grid, S is the collection of energy sources used on the grid, CIs is the carbon intensity of one specific energy source, Es is the amount of energy obtained from that energy source, and Eg is the total amount of energy on the grid. In plain English, this formula computes the carbon intensity of each energy source and then computes the weighted sum of those sources.
Knowing the carbon intensity of a grid allows electricity consumers, such as data centres running massive graph-processing workloads, to compute the carbon emissions of their activities by multiplying their electricity use by the carbon intensity of the grid they use to obtain their electricity. Once the carbon emission of a data-centre workload is known, we can start exploring approaches such as temporal shifting to reduce it.
What is Temporal Shifting?
The carbon intensity of grids that obtain energy from renewable sources can change significantly over time because the amount of renewable energy is highly variable and depends on factors such as the time of day and the weather. For example, the image below shows the Dutch energy grid over the course of one month. The top plot shows the amount of available renewable (green) and non-renewable (gray) energy on the grid, and the bottom plot shows the carbon intensity of the grid.
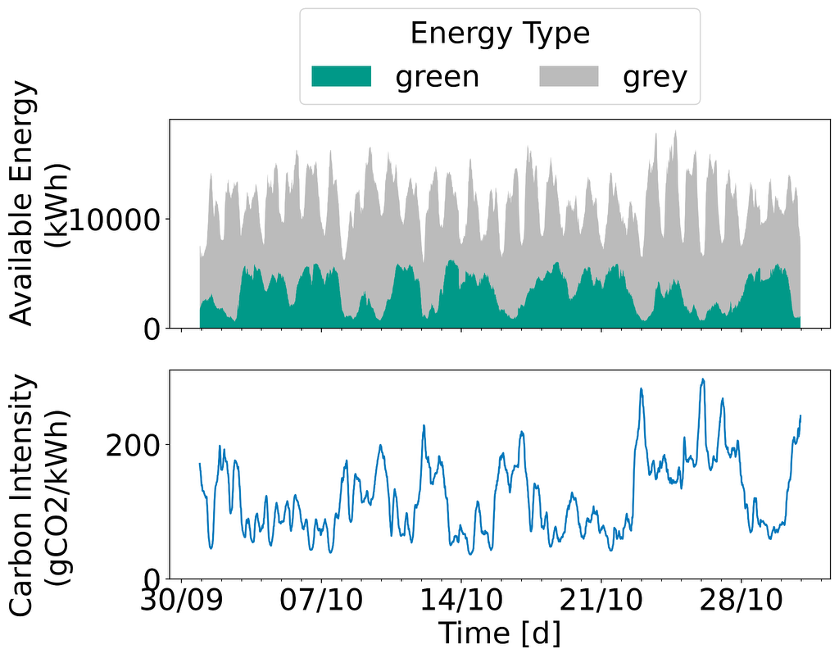
Energy mix and carbon intensity of the grid in the Netherlands during October 2023 [6].
Intuitively, we can reduce GHG emissions by using electricity when its carbon intensity is low. We can implement this approach for graph processing in data centres by delaying the execution of incoming workloads when carbon intensity is high and starting execution when carbon intensity is low. This effectively moves the workload in time, which we call temporal shifting. This idea has been suggested in related scientific work [3, 4, 5], but Graph Greenifier allows us to simulate, and therefore quantify, its effect.
The Graph Greenifier Approach
Graph Greenifier can simulate what happens in data centres during massive (graph-)processing workloads and supports simulating operational techniques such as temporal shifting. Operational techniques are actions data centres take to influence their operation. For example, selecting when and where to schedule a task. This allows data center operators, designers, and researchers to understand the impact of such techniques on both data center performance and sustainability. The figure below shows a simulation result from Graph Greenifier for this scenario.
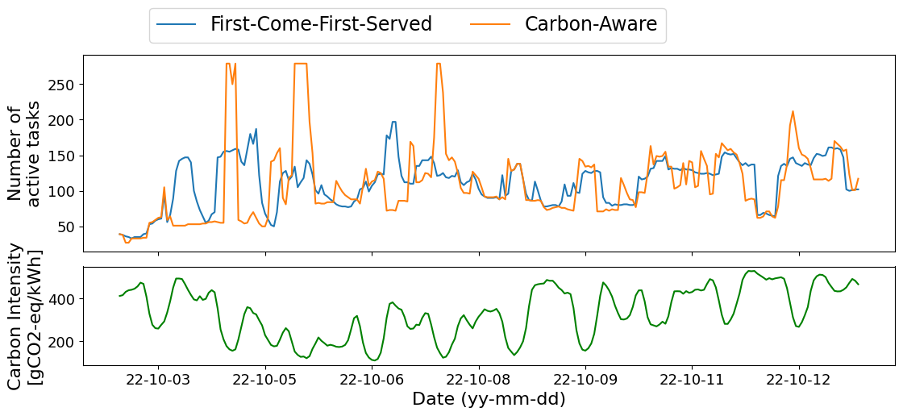
Simulation results comparing FCFS scheduling and Carbon-Aware scheduling.
Massive graph-processing workloads and other large workloads consist of many small tasks that need to be executed. The top plot in the figure shows the number of actively running tasks for two different scheduling approaches. The blue curve shows a traditional First-Come-First-Served (FCFS) scheduler, which schedules tasks to be executed as soon as possible, and in the order they arrive. The orange curve shows the Carbon-Aware scheduler, which delays the execution of incoming tasks when carbon intensity is high. The green curve in the bottom plot shows the carbon intensity of the grid over time.
We can see that the Carbon-Aware scheduler effectively delays tasks until carbon intensity is low by looking at the orange and green curves. Specifically, we see that the peaks in the orange curve (high number of active tasks) align with the valleys in the green curve (low carbon intensity). For this particular workload, the reduction in carbon emissions is 2.5%, but this can increase depending on the workload and the carbon intensity (variation) of the energy grid to which the data centre is connected.
Next Steps for Graph Greenifier
Temporal shifting is but one technique in a large collection of commonly used operational techniques in data centres. These include spatial shifting, checkpointing, and active-active replication, to name but a few. Additionally, changing the data-centre scheduling policy and other operational techniques can affect not only carbon emissions, but also workload performance and other non-functional properties.
By supporting these techniques in Graph Greenifier, scientists, data centre operators, and other stakeholders can explore “what-if” scenarios and perform a wide range of deep analyses using arbitrary combinations of these techniques to make a trade-off between sustainability and performance for their graph-processing workloads.
References
[1] Anders S. G. Andrae and Tomas Edler. 2015. On Global Electricity Usage of Communication Technology: Trends to 2030. Challenges 6, 1 (2015), 117–157. LINK
[2] Udit Gupta, Mariam Elgamal, Gage Hills, Gu-Yeon Wei, Hsien-Hsin S. Lee, David
Brooks, and Carole-Jean Wu. 2022. ACT: designing sustainable computer systems with an architectural carbon modeling tool. In Proceedings of the 49th Annual
International Symposium on Computer Architecture (New York, New York) (ISCA
’22). Association for Computing Machinery, New York, NY, USA, 784–799. LINK
[3] T. Sukprasert, A. Souza, N. Bashir, D. Irwin, and P. Shenoy, “On the limitations of carbon-aware temporal and spatial workload shifting in the cloud,” in EuroSys, 2024.
[4] Philipp Wiesner, Ilja Behnke, Dominik Scheinert, Kordian Gontarska, and Lauritz Thamsen. 2021. Let’s wait awhile: How temporal workload shifting can reduce carbon missions in the cloud. In Proceedings of the 22nd International Middleware Conference. 260–272.
[5] Jiechao Gao, Haoyu Wang, and Haiying Shen. 2020. Smartly handling renewable energy instability in supporting a cloud datacenter. In 2020 IEEE international parallel and distributed processing symposium (IPDPS). IEEE, 769–778
[6] D. Niewenhuis, S. Talluri, A. Iosup, and T. De Matteis, “Footprinter: Quantifying data center carbon footprint,” in HotCarbon, 2024.