
Innovations from the University of Bologna and CINECA in the Graph-Massivizer Project
Authors: Prof.Andrea Bartolini (Associate Professor at University of Bologna) and Junaid Ahmed Khan (PhD student and Research Fellow at the University of Bologna)
Modern data centers and high-performance computing (HPC) systems generate extraordinary volumes of telemetry data. The CINECA Marconi100 supercomputer alone produced approximately 49 terabytes of uncompressed operational data, with individual systems containing up to one million unique sensors sampling at 20-second intervals [1]. This data flows continuously from compute nodes, memory subsystems, power delivery infrastructure, cooling systems, and storage components—creating an unprecedented wealth of operational intelligence. Yet despite this abundance, extracting actionable insights remains remarkably difficult.
The fundamental challenge lies not in data collection but in data access. Operators seeking to understand system behavior must navigate three simultaneous barriers: deep domain expertise in HPC operations, intimate knowledge of the specific monitoring framework architecture, and proficiency in the query languages and APIs of underlying NoSQL databases. This triple requirement effectively restricts analytical capabilities to a small group of specialists, leaving the vast potential of operational telemetry largely untapped.
Researchers at the University of Bologna, in collaboration with CINECA (Italy’s largest supercomputing center), have spent several years addressing this challenge through the EU-funded Graph-Massivizer project. Their work traces an evolution from complex manual queries through structured knowledge representations to an intelligent natural language assistant capable of answering operational questions with over 92% accuracy—transforming how facility managers and engineers interact with their data.
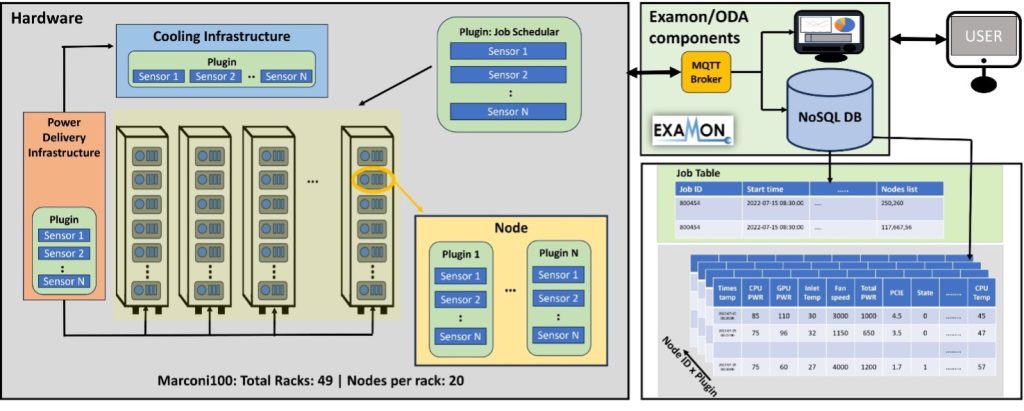
Figure 1: Examon’s massive scale and data heterogeneity
The Marconi100 (M100) system at CINECA utilizes a holistic monitoring framework for operational data analytics called “ExaMon”. It is designed to collect data from various sources, including hardware sensors, software logs, and performance metrics, and stores this data in a NoSQL database (Cassandra, with KairosDB for time-series) in a centralized repository. Figure 1 shows the complexity of the data collected at the M100 system using the ExaMon framework. It integrates data from nine specialized plugins that collect a wide spectrum of information—from air-conditioning and power-distribution data (Vertiv, Schneider, Logics) to node-level sensor telemetry (IPMI), cluster-wide performance metrics (Ganglia, SLURM, Nagios), and external environmental conditions (Weather). Each plugin contributes its own set of metrics and plugin-specific fields, resulting in a highly heterogeneous and multidimensional dataset. This diversity of data sources underscores the complexity of the monitoring environment.
Structured Understanding Through Domain Ontology
The research began by recognizing that the schema-less nature of NoSQL databases—while enabling flexibility and scalability—creates fundamental obstacles for complex analytical queries. Without predefined schemas, users must manually establish connections between different data sources, navigate vendor-specific naming conventions, and construct multi-step query chains that require extensive domain knowledge.
The team’s first innovation was developing a domain-specific ontology for operational data analytics telemetry [2]. Unlike existing data center ontologies that focus primarily on inventory cataloging and infrastructure documentation, this ontology captures the critical relationships between topological components, hardware systems, and job execution data. The representation mirrors how domain experts actually conceptualize HPC operations: racks contain compute nodes positioned in three-dimensional space, plugins organize sensors that produce timestamped readings, and submitted jobs connect directly to the computational resources they utilize. Figure 2 shows the developed ODA ontology.
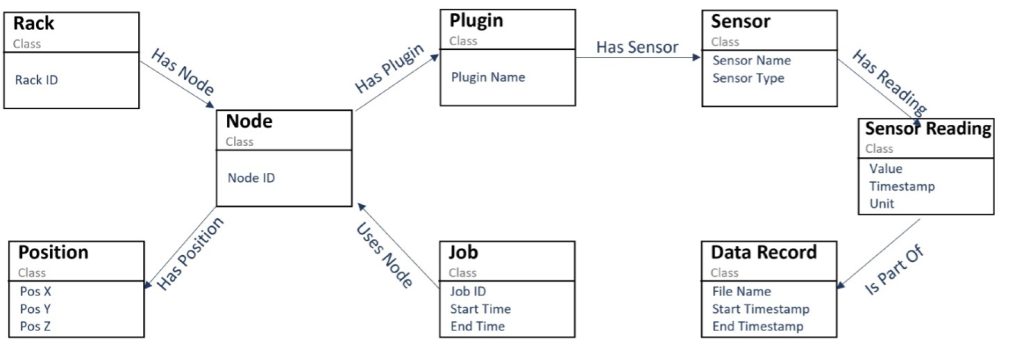
Figure 2: Operational data analytics (ODA) Ontology
This structured representation enables queries through SPARQL, a graph query language whose logical structure follows the natural relationships in the data. Comparative analysis revealed dramatic simplifications: complex queries requiring dozens of lines of Python code with multiple sub-queries in NoSQL approaches could be expressed in just five to fifteen lines of SPARQL. More significantly, these queries follow paths that non-experts can understand by tracing relationships through the ontology—from rack to node to plugin to sensor to reading—without requiring intimate knowledge of database internals.
The approach proved particularly valuable for queries involving relationships across data sources. Calculating the average power consumption during a specific job’s execution, for instance, traditionally requires querying the job table to identify execution times and allocated nodes, then separately querying sensor tables for power readings during those intervals, and finally correlating the results through manual data manipulation. With the knowledge graph approach, this becomes a single query that traverses the explicit job-to-node-to-sensor-to-reading pathway defined in the ontology.
Confronting the Scalability Challenge
While the ontology approach proved effective for query simplification, a fundamental scalability challenge emerged during implementation. Converting time-series telemetry data into RDF triples resulted in storage requirements approximately 745 times larger than equivalent NoSQL representations. For a single month of data from just one monitoring plugin on the Marconi100 system, this translated to nearly three terabytes of graph storage versus four gigabytes in compressed Parquet format. Such overhead rendered full materialization impractical for production environments.
The solution emerged through virtual knowledge graphs—a technique that constructs graph representations on-demand, containing only the data relevant to answer a specific user query. Rather than materializing the entire dataset as a persistent graph, the system dynamically extracts entities from user questions, fetches relevant data from the NoSQL datalake based on identified time ranges and metrics, constructs a temporary lightweight graph, and executes queries against this focused representation.
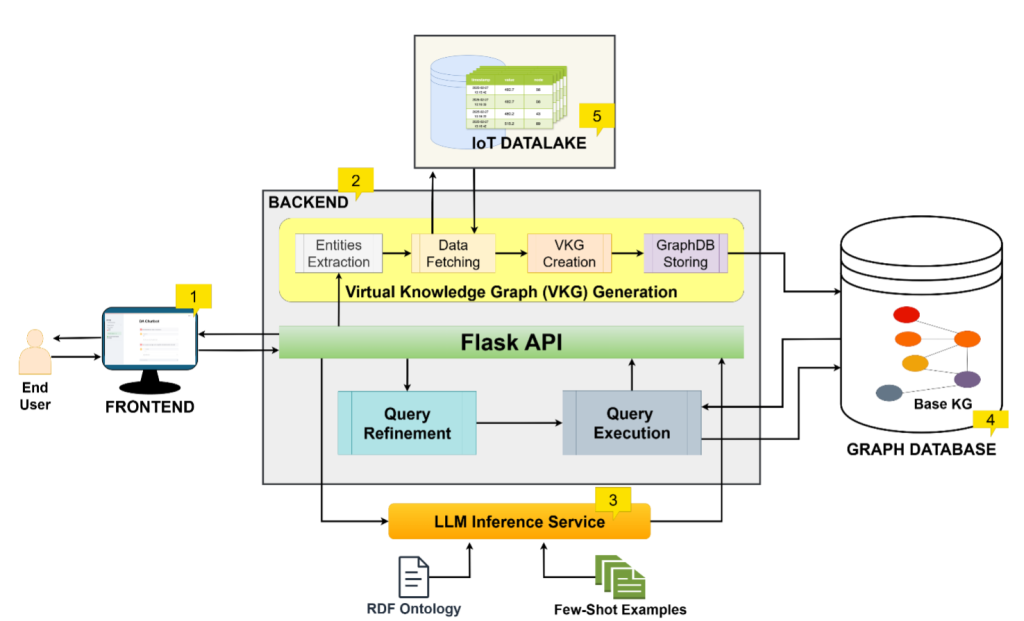
Figure 3: Data Analytics (DA) Chatbot
Figure 3 shows the proposed end-to-end architecture for the Data Analytics (DA) chatbot for data centers and HPC [3]. The architecture contains five components: (1) Frontend, built using streamlit library, that provides a chatbot interface to the user, (2) Backend, that is built using FlaskAPI, once it receives a user question, two concurrent processes of SPARQL generation and Virtual Knowledge Graph (VKG) generation is started. SPARQL is generated using the (3) LLM inference service, that takes as input the user input prompt in natural language along with the ODA ontology, to guide the LLM about the logical data model, and a set of few-shot examples as context. Meanwhile, the second concurrent task of VKG takes the user prompt, and using natural language processing tools, such as pattern matching and rule-based critertias to extract the necessary entities from the user text that guides the system of which parameters and sensor data to fetch from the (5) IoT datalake component of the system. Once these entities are extracted, using templated query codes, specific to the IoT datalake, the system fetches the data and then maps it according to the ODA ontology to create the virtual knowledge graph and then this graph is stored inside the (4) Graph database. Inside the graph database, their is already a Base-KG that contains the system’s topological and spatial metadata and combining these with the incoming virtual knowledge graph, the system now has the required data to get the answer to the initial natural language user question. Finally, the generated SPARQL query is executed on the SPARQL endpoint of the (4) Graph Database, and the corresponding answer is then returned back to the user on the (1) Frontend, as a table, or in case of a large table with more than 50 rows, as a CSV downloadable link.
This approach maintained the semantic advantages of knowledge graphs while reducing storage overhead to manageable levels. The maximum observed virtual knowledge graph size across evaluated queries was just 179 megabytes—trivial compared to multi-terabyte full materializations. The team further optimized the generation pipeline through several technical refinements: adopting the Polars library for data processing (achieving 92.75% faster data fetching than the initial Pandas implementation), selecting N-Triples serialization format for its speed advantages, and implementing batch triple generation rather than incremental graph construction.
Natural Language Meets Graph Intelligence
The culmination of this research trajectory is EXASAGE—the first operational data analysis assistant for HPC systems [4]. The figure 4 shows the architecture diagram of EXASAGE framework. EXASAGE combines the structured power of knowledge graphs with large language models to create a natural language interface for telemetry data, enabling operators to ask questions in ordinary language and receive accurate, contextually appropriate responses.
The system architecture reflects careful integration of complementary technologies. An input validator extracts key entities from natural language questions—identifying nodes, racks, jobs, metrics, and time ranges through rule-based algorithms aligned with the domain ontology. The LLM-query generator translates these validated questions into SPARQL queries, grounded by the ontology schema and few-shot examples that demonstrate correct query patterns. Simultaneously, the virtual knowledge graph generator constructs a query-specific graph containing precisely the data needed to answer the question. A query refinement stage then corrects common LLM-generated syntax errors through pattern matching before execution.
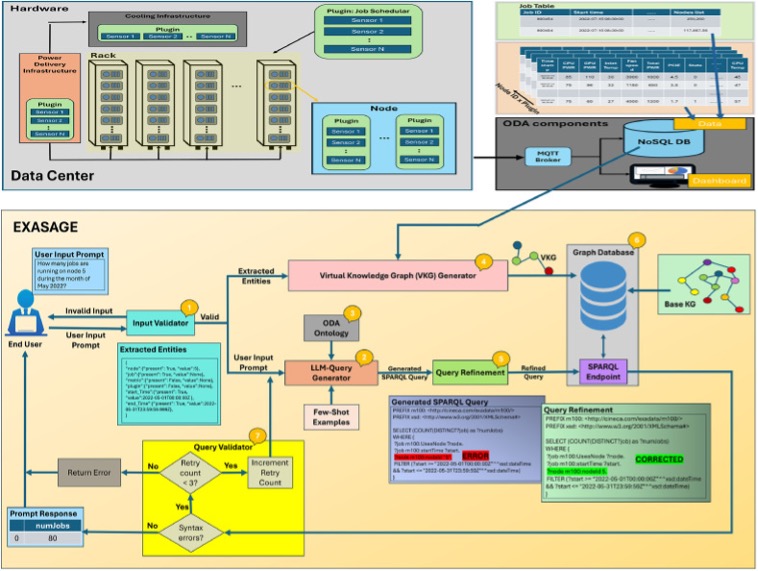
Figure 4: EXASAGE: The first data center operational data analysis assistant, shown as a block diagram.
Evaluation across one thousand queries demonstrated remarkable effectiveness. The system achieved 93.6% accuracy in generating correct SPARQL queries and retrieving accurate answers—compared to just 25% accuracy when large language models attempted to generate equivalent NoSQL queries directly. This dramatic difference stems from the knowledge graph’s explicit encoding of relationships between data sources: information that NoSQL approaches require users to establish manually through multiple coordinated queries.
The knowledge graph approach also proved more efficient in practice. SPARQL queries generated by the system were significantly more concise, with 56.89% fewer output tokens on average, and executed faster despite the additional virtual knowledge graph construction step. Optimization efforts reduced complete end-to-end latency from 20.36 seconds to just 3.03 seconds—an 85% improvement that makes the system practical for interactive analytical sessions rather than batch processing alone [3].
Toward Universal Interoperability
The most recent advancement extends this work toward cross-system analytics through a unified ontology designed to support multiple heterogeneous HPC environments [5]. The figure 5 shows the developed ontology, comprising 164 axioms: 104 logical axioms defining semantics (e.g., domains, ranges, characteristics, inverses) and 60 declarations introducing named entities. The ontology defines 12 classes representing core HPC concepts—jobs, compute nodes, racks, sensors, users—and includes 23 object properties for inter-class relations (e.g., job-tonode, rack-to-node) and 25 data properties linking individuals to literals (e.g., timestamps, metrics). Designed for interoperability across heterogeneous HPC systems, the schema supports multiple facilities via DataCenter and HPCSystem, captures workloads through User, Job, and JobMetric, and models infrastructure layout with Rack, ComputeNode, and Position. Monitoring data is represented via Sensor and SensorReading, while temporal dynamics are abstracted with the Time class, enabling representation of time-dependent events and relationships. The Plugin class models software components involved in monitoring and analysis. The research team validated this generalized schema on the two largest publicly available operational datasets from top-ranked supercomputers: the Marconi100 dataset [1] from CINECA in Italy and F-DATA [6] from the Fugaku supercomputer at RIKEN in Japan.
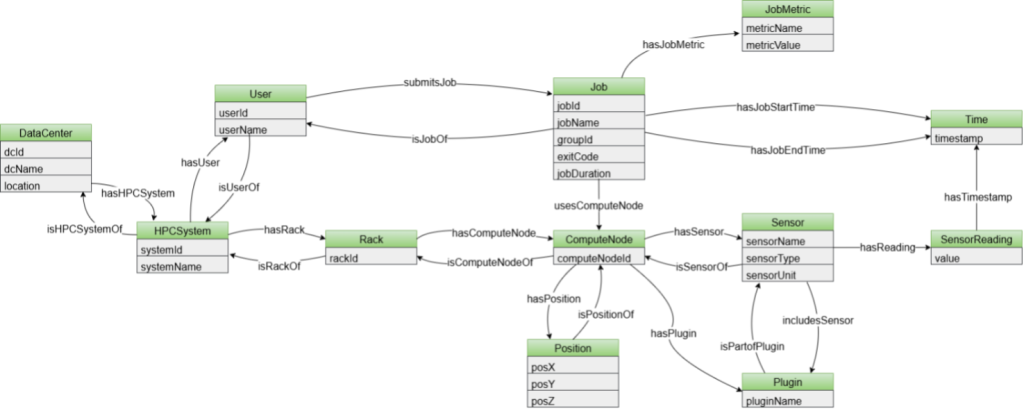
Figure 5: Unified ODA Ontology
This unification required addressing fundamental differences in how facilities conceptualize and record operational data. While the Marconi100 telemetry follows a sensor-centric model where time-series readings attach to physical monitoring devices, Fugaku’s F-DATA dataset is fundamentally job-centric—recording performance metrics per job rather than per sensor. The unified ontology accommodates both paradigms through new classes that capture data center and HPC system hierarchies, user-specific workload patterns, and job-level metrics alongside traditional sensor readings.
The team also addressed storage efficiency through ontology design optimizations. By eliminating redundant classes, centralizing timestamp representations through a dedicated Time class with Unix encoding, and relocating unit specifications from individual readings to parent sensor definitions, the unified ontology achieves 38.84% storage reduction compared to the previous approach. Additional deployment configurations using blank nodes for sensor readings provide a further 26.82% reduction when global addressability of individual readings is not required.
The unified ontology was validated against 36 competency questions spanning system topology, sensor monitoring, job execution analysis, user activity patterns, scheduling efficiency, and cross-system comparative analytics. Questions that would be essentially impossible with traditional approaches—such as comparing average job execution times across different HPC systems or identifying which facility achieves better energy efficiency per job—become answerable through standardized SPARQL queries operating over the unified schema.
Implications for Operational Intelligence
This research progression—from complex NoSQL queries through unified ontologies and virtual knowledge graphs to intelligent natural language assistants—represents a fundamental shift in how data center operators can interact with telemetry data. The implications extend beyond high-performance computing to any IoT environment generating heterogeneous time-series data at scale.
The core insight is that knowledge graphs, when combined with modern language model capabilities and careful architectural optimization, can bridge the gap between massive operational datasets and actionable insights. By encoding domain semantics explicitly and leveraging the reasoning capabilities of language models, these systems enable facility managers, system administrators, and engineers to query telemetry data using questions they would naturally ask—rather than requiring mastery of database internals and query languages.
The accuracy improvements are particularly striking. A 92-93% query accuracy rate versus 25% for direct LLM-to-NoSQL approaches reflects more than incremental optimization; it demonstrates that providing structured semantic context transforms language models from unreliable query generators into effective analytical partners. The knowledge graph supplies precisely the relational information that large language models struggle to infer from unstructured database schemas.
As data centers grow in complexity to meet AI-driven computational demands, these graph-powered approaches offer a scalable path toward intelligent, accessible operational analytics. The research demonstrates that the barrier between operational data and operational insight need not remain as high as current practices suggest—and that thoughtful integration of semantic technologies with modern AI can democratize access to the intelligence hidden within facility telemetry.
Conclusion
In conclusion, thanks to the Graph-Massivizer project, CINECA and UNIBO have demonstrated that graph-based data representation is a key enabler for future autonomous and sustainable data centres: democratizing data and trasforming them from a storage overhead into actionalble insight. This research will be a valuable asset for the future development of data centres, enabling simpler, more effective, and more intelligent operational optimization.
References
[1] Borghesi, Andrea, et al. “M100 Exadata: a data collection campaign on the CINECA’s Marconi100 Tier-0 supercomputer.” Scientific Data 10.1 (2023): 288.
[2] Junaid Ahmed Khan, Martin Molan, Matteo Angelinelli, and Andrea Bartolini. 2024. ExaQuery: Proving Data Structure to Unstructured Telemetry Data in Large-Scale HPC. In Companion of the 15th ACM/SPEC International Conference on Performance Engineering (ICPE ’24 Companion). Association for Computing Machinery, New York, NY, USA, 127–134. https://doi.org/10.1145/3629527.3652898
[3] Junaid Ahmed Khan, Hiari Pizzini Cavagna, Andrea Proia, Andrea Bartolini. “From Data Center IoT Telemetry to Data Analytics Chatbots — Virtual Knowledge Graph is All You Need.” arXiv preprint, https://doi.org/10.48550/arXiv.2506.22267
[4] Khan, Junaid Ahmed, Martin Molan, and Andrea Bartolini. “EXASAGE: The First Data Center Operational Data Analysis Assistant.” Future Generation Computer Systems (2025): 108185.
[5] Khan, Junaid Ahmed, and Andrea Bartolini. “A Unified Ontology for Scalable Knowledge Graph-Driven Operational Data Analytics in High-Performance Computing Systems.” arXiv preprint arXiv:2507.06107 (2025)
[6] Antici, F., Bartolini, A., Domke, J. et al. F-DATA: A Fugaku Workload Dataset for Job-centric Predictive Modelling in HPC Systems. Sci Data 12, 1321 (2025). https://doi.org/10.1038/s41597-025-05633-1